Developer Dashboard MLS Cyprus: Managing Projects, Leads, and Listings from One View
Manage all your real estate projects, leads, listings, and client data from one central dashboard. Keep records up to date, streamline workflows, and help your team work more efficiently.
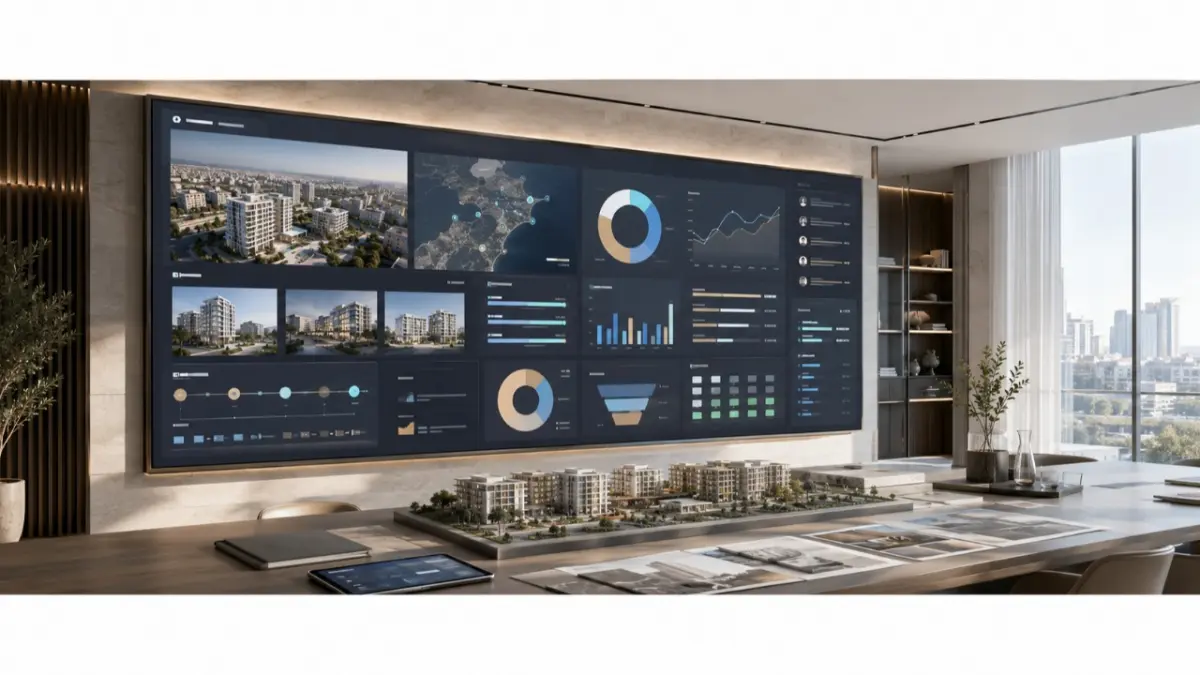
A development team is preparing for a sales meeting on a new project in Limassol. Project inventory sits in one spreadsheet, buyer inquiries are stored in the CRM, listing updates are kept in another file, and the latest availability was shared in a chat the previous day. The team has enough information, but no one can immediately confirm which version is current. Before managers can discuss performance, they first need to rebuild the operating picture from separate sources.
For this kind of visibility problem, a developer dashboard MLS Cyprus workflow can bring project inventory, lead activity, listing status, and sales signals closer together. A dashboard is not valuable because it adds more charts. It is valuable because it gives developers, managers, and sales teams a clearer place to understand what is happening before they make decisions about projects, follow-up, campaigns, or distribution.
Fragmented Visibility Slows Down Project Decisions
Real estate teams often have more data than they can use effectively. The CRM may show buyer activity, but not enough inventory context. A spreadsheet may show available units, but not whether those units are attracting interest. A listing file may include updated property details, while agents are still working from an older version. When these elements sit in different places, every meeting starts with data checking instead of decision-making.
The problem becomes more serious as the number of projects grows. A developer managing several cities, property types, and sales channels needs to understand where activity is building, which listings need attention, and which buyer inquiries require follow-up. If every answer depends on another file, another export, or another message, reporting becomes fragile. The dashboard should reduce that gap by turning scattered operational signals into a clearer working view.
What a Central Dashboard Should Make Easier
A central dashboard should help teams review project activity without rebuilding the same report every week. It should connect the inventory side of the business with the sales and visibility side: what is available, what is active, what buyers are asking about, and where the team needs to act next.
- Project inventory — Without a central dashboard, teams compare spreadsheets and messages to understand available stock. With a stronger dashboard workflow, inventory can be reviewed from a single shared view.
- Listing status — Availability checks interrupt the sales process when information is scattered. A centralized dashboard makes listing status easier to reference before every follow-up.
- Buyer inquiries — Lead activity is often disconnected from the relevant property information. A stronger dashboard lets teams view buyer interest alongside the corresponding inventory.
- Sales meetings — Managers spend valuable time assembling basic project information before discussions begin. With a centralized dashboard, meetings can focus on decisions, priorities, and next steps.
- Reporting — Reports require manual compilation from multiple sources. A structured dashboard helps managers interpret project activity through organized, up-to-date data.
The dashboard does not replace management judgment. It gives the team a more reliable starting point for that judgment.
Cyprus Context: Several Cities, Several Buyer Types, One Visibility Problem
Cyprus developer teams often manage mixed inventory across Limassol, Paphos, Larnaca, and Nicosia. At the same time, they may work with local buyers, overseas buyers, investors, relocation clients, partner agents, and brokers. Each group may ask different questions, and each project may pass through several channels before a buyer reaches the sales team.
In that environment, a dashboard becomes useful only when it reflects structured property data. If the underlying records are outdated, duplicated, or incomplete, the dashboard will simply make the confusion more visible. If the inventory layer is clean, the team can understand where buyer interest is growing, which listings need review, and which project records require attention before the next sales or campaign decision.
Management View for Project Performance
Managers need to see more than isolated leads. They need to understand the relationship between project activity, availability, and follow-up. A project performance dashboard helps teams move from scattered reporting to practical review: which projects are active, which units are still available, which listings are receiving interest, and where a sales conversation is slowing down. This changes the meeting from a data-collection exercise into a management conversation.
For property developers, the commercial value is visibility before action. A project may look active in the market but still require attention if buyer inquiries are not moving into follow-up, if certain units are no longer available, or if agents continue using outdated project information. The dashboard does not guarantee stronger sales performance, but it can support more consistent review because the team works from one operational picture.
What the Analytical Layer Should Bring Together
A good reporting layer should organize operational signals without creating a false sense of certainty. An analytics suite can help the team review inventory, listing movement, buyer inquiries, follow-up activity, and management reporting in one place. The important question is not how many charts the interface has, but whether the data behind those charts is current, relevant, and connected to the team’s workflow.
At a high level, an analytics view may help developers monitor active projects, available units, listing status, lead activity, pipeline movement, and team follow-up. These are general dashboard concepts, not confirmed RealtyHub product features. Exact modules, metrics, filters, exports, permissions, screenshots, refresh behavior, and alerts should be confirmed with the RealtyHub product team before final publication.
Design the Dashboard Around Decisions
A dashboard should be planned around the decisions it needs to support. If the team needs to decide which project requires attention, the interface should provide project visibility. If sales managers need to review follow-up quality, they need lead and activity context. If developers need to understand availability across several cities, the dashboard should be built around structured inventory data.
A useful view should show which projects are active, which listings are current, where buyer inquiries are coming from, which follow-ups remain open, and where sales activity is not moving into a next step. These elements should not be added as decoration. They should reflect the real questions managers and sales teams ask before they act.
Implementation Starts with the Data Source
A dashboard project should begin with the data source, not the visual layout. The team first needs to define where current project and listing information lives, which fields should appear in the dashboard, who can see each view, and how updates will be handled. Without that foundation, the interface may become another layer that repeats the same inconsistencies already present in spreadsheets, CRM exports, and project files.
The practical implementation process should include inventory cleanup, listing status rules, lead and inquiry mapping, access control, GDPR-sensitive data handling, and testing with real sales scenarios. The team should check how the dashboard behaves when a unit becomes unavailable, when a project receives new buyer interest, when a manager prepares for a sales meeting, or when a listing needs review before a campaign. These situations show whether the system supports real decisions or simply displays information.
Practical Framework Before Launch
Before launching a developer dashboard, the team should confirm the operating rules that affect trust and usability. The framework should stay focused on data quality, access, and decision support.
- Define the source of truth for project inventory.
- Confirm which project and listing fields are required.
- Decide which lead and inquiry data should appear.
- Review listing status logic and availability rules.
- Define dashboard views for managers, sales agents, and operations teams.
- Confirm access permissions and sensitive data handling.
- Test reporting views with real project and sales scenarios.
- Confirm who maintains the dashboard after launch.
- Verify which metrics, filters, and screenshots are approved for publication.
RealtyHub-specific details require separate product confirmation. This includes exact dashboard modules, available analytics views, exports, alerts, permissions, CRM or API connections, update frequency, and approved UI examples.
Cyprus Workflow Examples
A Limassol sales manager may review active listings, buyer inquiries, and project availability before a weekly meeting. With a stronger dashboard workflow, the team spends less time collecting basic context and more time deciding which opportunities require action.
A Paphos sales team may need to compare villa availability with buyer follow-up activity. If those signals are stored separately, agents spend time checking before responding. A dashboard can make the operating picture easier to review.
A Larnaca developer may need to see which units changed status before agents continue sending options to buyers. In this case, the dashboard supports communication control, not only reporting.
A Nicosia leadership team may need a management view across project activity, sales progress, and available inventory. A structured dashboard helps leadership understand where attention is needed without waiting for a manually rebuilt report.
What the Dashboard Should Not Overclaim
A dashboard can make activity visible, but it should not turn weak data into strong conclusions. If project records are outdated, duplicated, or incomplete, the dashboard will not make them reliable simply by displaying them in a cleaner format. If buyer inquiries are poorly qualified, charts will not automatically improve the pipeline. If availability is not maintained, reporting can still mislead the team.
The article should therefore avoid claims about guaranteed sales growth, exact time savings, automatic performance improvement, or future demand. A stronger and safer position is that a dashboard for developers can support clearer visibility, more consistent review, and better-prepared management conversations when the underlying inventory data is structured.
RealtyHub MLS as the Platform Layer Behind Visibility
RealtyHub MLS can be positioned as the platform layer that helps developer teams organize project and listing data before it appears in dashboard views. The dashboard becomes stronger when the inventory behind it is current, structured, and easier to manage. If project data remains scattered across PDFs, spreadsheets, CRM notes, and disconnected tools, the interface may become only a cleaner-looking version of the same disorder.
For developers and property teams, the commercial value is clearer operational visibility. Project inventory, listing status, buyer context, and reporting become easier to manage when they are closer to one platform layer. Teams evaluating this workflow should consider RealtyHub MLS as the next step, while confirming product-specific dashboard features before making public claims.
Conclusion: A Visibility Layer for Project Decisions
In a developer dashboard MLS Cyprus workflow, the main goal is to give real estate teams a clearer view of projects, listings, leads, and sales activity before decisions are made. A project performance dashboard can support management conversations, and an analytics suite can organize useful operational signals when the property data behind them is reliable.
The strongest next step is to define the source of truth, confirm dashboard requirements, and build reporting around the platform layer that manages project inventory.
FAQ
What should a property developer dashboard include?
It should usually include project inventory, listing status, availability, lead activity, sales pipeline context, and reporting views that help the team understand current activity.
How does an MLS dashboard help real estate teams?
It can organize property and listing information into a clearer view, so the team does not need to rebuild reports from scattered files and messages.
What is a project performance dashboard used for?
It helps managers and sales teams review project activity, inventory movement, buyer interest, and follow-up needs in a more structured way.
What data should appear in a reporting dashboard?
Useful data may include inventory fields, listing status, buyer inquiries, project activity, sales pipeline stages, and team follow-up signals.
How can a private MLS support dashboard workflows?
It can provide a structured inventory layer that dashboard views use for clearer project, listing, and availability reporting.
Author
This material was written by Maria Vashchenko.
For questions, collaboration, or further discussion, feel free to contact me on LinkedIn.